🚀
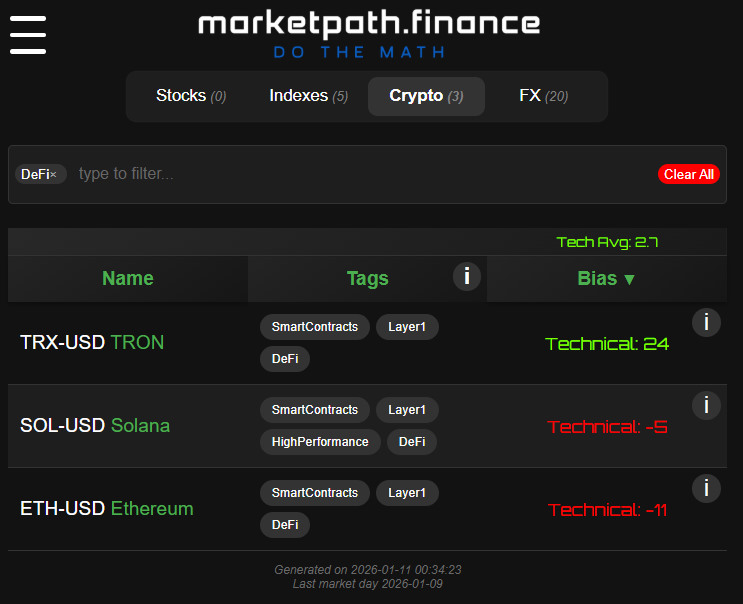
 MarketPath.finance offers a reliable tool for investment insights by seamlessly integrating technical analysis with fundamental evaluations, providing proprietary rankings for U.S. stocks, indices, cryptocurrencies, and forex pairs. In today's dynamic financial landscape, MarketPath.finance provides a straightforward platform that combines technical analysis—leveraging carefully curated historical patterns—with key fundamental metrics such as earnings projections, analyst ratings, and valuations. This results in a proprietary ranking system covering thousands of U.S. stocks, major indices, cryptocurrencies, and forex pairs.
 Powered by daily ETL processes that extract, cleanse, and normalize raw data from exchanges and financial providers—ensuring accuracy through adjustments for splits, dividends, and invalid entries, plus multi-level categorization via tags and GICS hierarchies—it helps users explore market patterns with a data-driven approach suitable for both everyday investors and professionals familiar with platforms like Bloomberg.
 MarketPath.finance is AI-powered, leveraging the capabilities of Grok to refine financial data and derive insights from historical price action scenarios. This integration allows for the calculation of potential edges in investment strategies, providing users with data-driven perspectives based on past market behaviors in a practical and accessible manner.

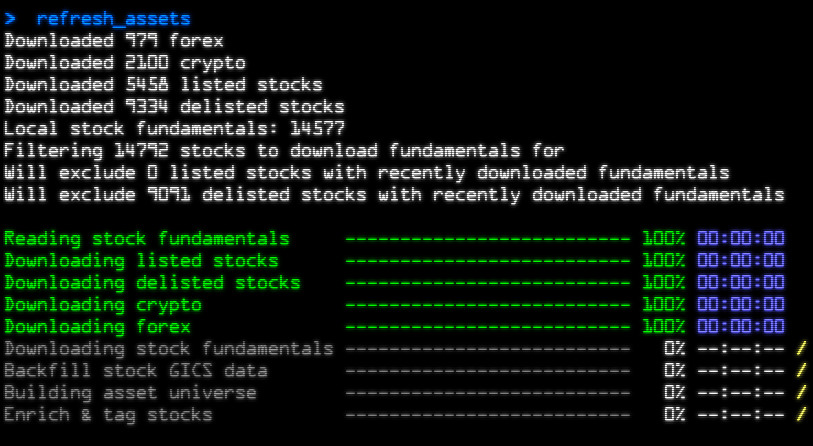
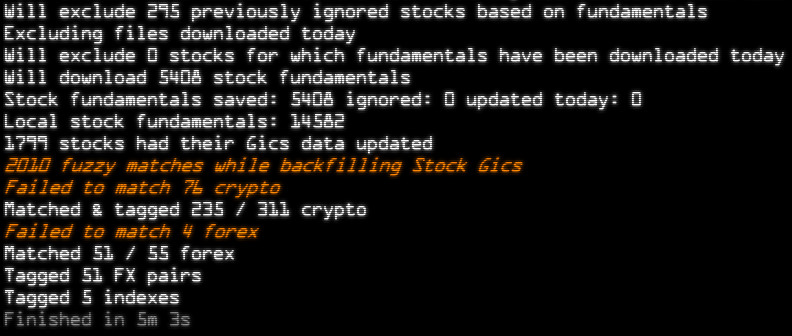
 We handle the heavy lifting of processing, analyzing, and interpreting large amounts of complex data so you don't have to—making it easier for you to get insights or make decisions. Our core is a rigorous daily ETL (Extract, Transform, Load) pipeline: we extract raw data from stock exchanges and trusted providers, transform it through meticulous cleansing (removing corrupted prices, adjusting for corporate actions like splits and dividends, and normalizing for consistency), and load it into structured formats enhanced with multi-level categorizations—including custom tags for attributes like market cap or exchange, and the full GICS hierarchy for sectors, groups, industries, and sub-industries. This ensures the data's reliability and comparability over time, giving users an edge in identifying potential opportunities without the noise of unprocessed feeds. Our charts display current price action alongside aggregated trajectories from comparable scenarios, offering a clear view of possible paths ahead. Designed for retail investors building portfolios or professionals using tools like Bloomberg terminals, MarketPath.finance delivers practical, algorithmic insights in an accessible interface to support informed decision-making across various market conditions.
The market path is a chart that displays the historical and projected price trajectory of the base asset (e.g., a stock, index, cryptocurrency, or forex pair).
- The **white line** represents the asset's actual closing prices over recent months, providing a clear view of its historical performance.
- The **blue line**, known as the "Market Path," is a sophisticated aggregate forecast derived from advanced pattern recognition. By analyzing a curated basket of related assets with similar historical behaviors, we identify analogous scenarios from the past and compute an averaged trajectory. This creates a predictive pathway that highlights potential future movements, offering valuable insights for traders and investors. It's a powerful tool that distills complex market dynamics into an intuitive visual guide, though it remains a probabilistic estimate influenced by evolving conditions.
- The **vertical dashed line** indicates the cutoff point for the analysis—the last available data point for the base asset, which typically aligns with its most recent known price. Beyond this line, the Market Path extends as a forward-looking projection based on historical analogies.